COMPETITIVE MATRIX EXAMPLES: 5 WAYS TO COMPARE COMPETITORS

Analyzing your competitive landscape is key to understanding where and how you fit into the market of available solutions. Plotting and comparing solutions in a competitive matrix allows you to gain perspective and insight about where you fit into the overall playing field – how you stack up and where your strengths lie. Effective competitive comparisons start with benchmarking your own company and creating a framework to evaluate each solution across a set of dimensions. Here are a few types of competitive matrices that can provide insight into your market landscape.
Third Party Competitive Matrix Examples
In addition to gaining high level market perspective, third party matrices are important to evaluate because potential customers may leverage these grids before choosing a solution. Sites like G2 Crowd and Gartner gather their own inputs to determine the ranking of each company, which can provide additional detail you may not otherwise gather as you evaluate the competitive landscape.
Download our Free Competitive Analysis Template
G2 Crowd Grid
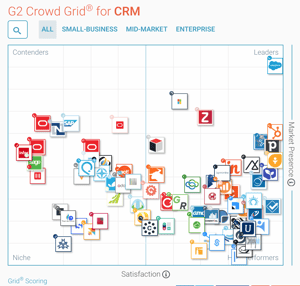 G2 Crowd’s industry grids allow you to see how your company stacks up in terms of customer satisfaction. G2 Crowd plots each competitor by Market Presence and Customer Satisfaction. Companies with a large market presence and high customer satisfaction (based on reviews on their site) are deemed “Leaders”, while those with low presence and low satisfaction are designated “Niche” solutions. “Contenders” (large market presence, low satisfaction) and “High Performers” (low presences, high satisfaction) round out the grid. This matrix is helpful for identifying the scale of the company’s reach and the feedback from the market. If your company falls into the “High Performers” square, you know to focus your efforts on increasing awareness of your solution, leveraging past success with customer satisfaction.
Image Source: G2 Crowd Best CRM Software
Gartner Magic Quadrant
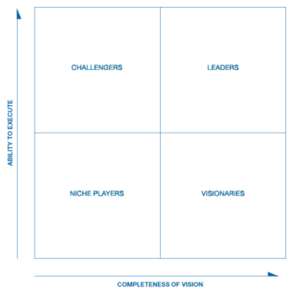 Gartner’s Magic Quadrant plots each company by their Ability to Execute and their Completeness of Vision. The best of both are the “Leaders” and the worst of both are “Niche Players.” The innovative solutions who have yet to execute are the “Visionaries” and the execution-oriented but not-so-innovative companies are the “Challengers.” This type of matrix is helpful for uncovering which competitors are adapting with the market – the visionaries and leaders – so that you know who will remain or become dominant rivals in the future. This matrix can also help you discover which companies to research in regards to leveling up your execution skills: what are the company and product factors that lead to a company being named a “leader” or “challenger”?
Image Source: Gartner Magic Quadrant Methodology
DIY Competitive Matrix Examples
While third party analyses can provide helpful perspective on your market, they may not get into the details that you want to evaluate in your specific market. Developing a competitive matrix leveraging your own set dimensions allows you to tailor your analysis to the output you desire – if you’re looking to improve win/loss rates, a matrix diving into those metrics can be most helpful. If you’re looking to evaluate which emerging competitors to monitor, a competitive overview matrix may be a good starting point. Here are a few competitive matrices you can build with your team to gain new perspective on your market.
Win / Loss Matrix
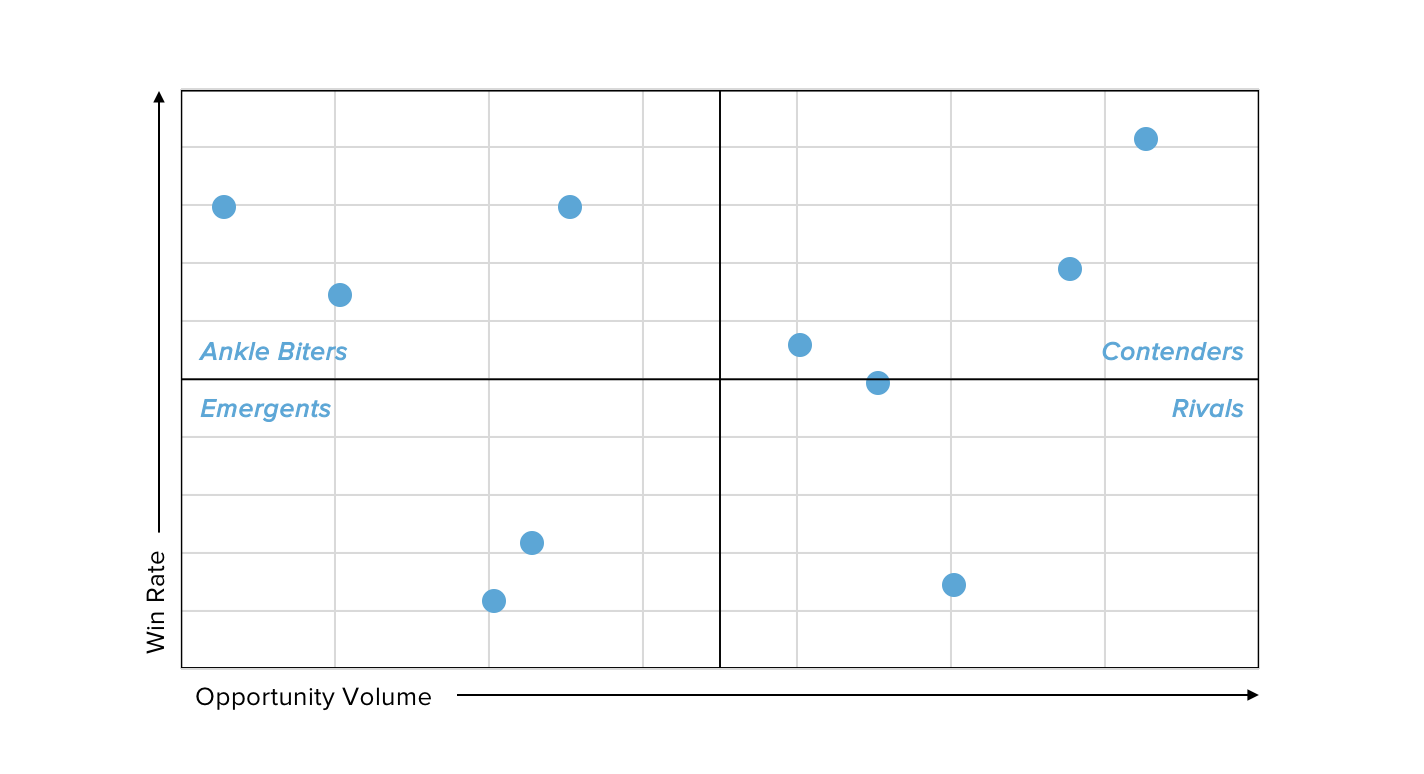
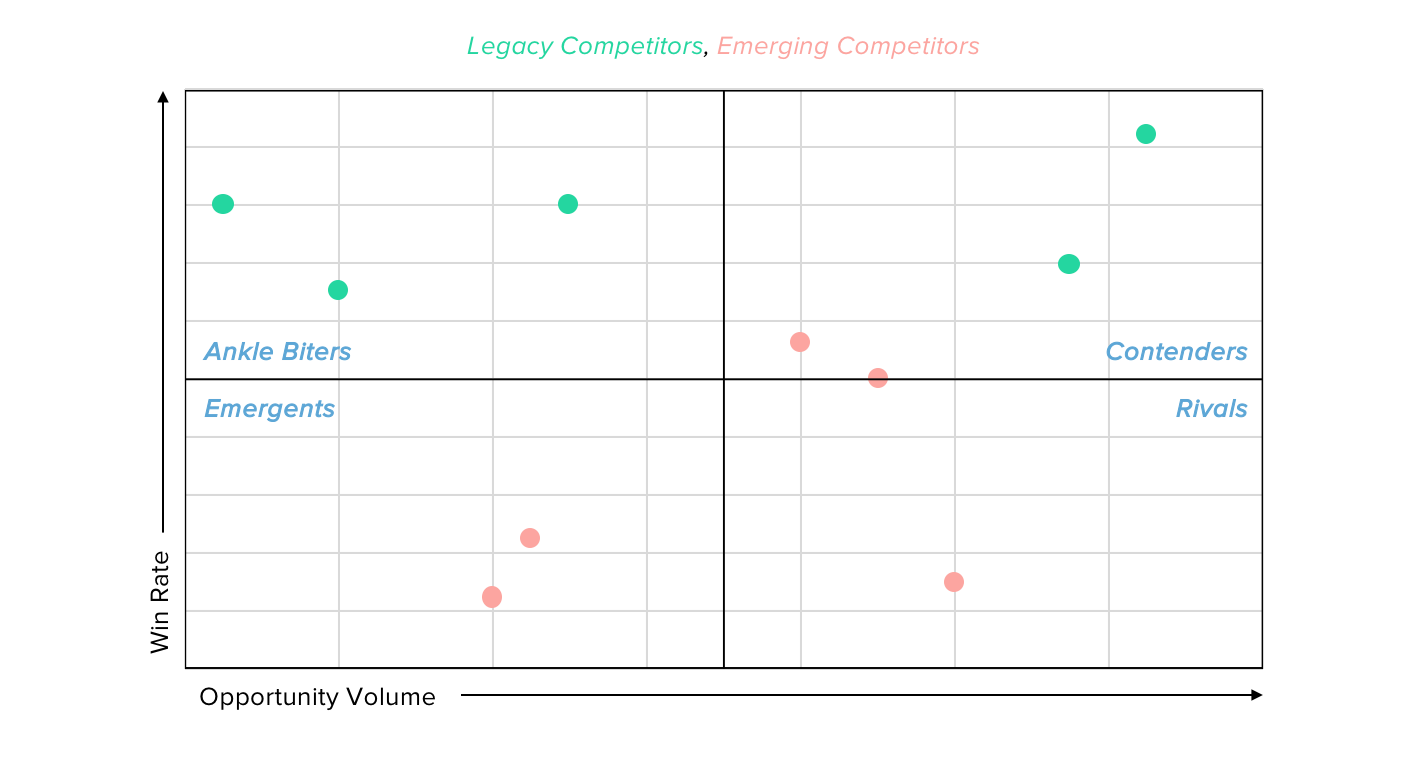
A win/loss matrix is a tool for identifying where you struggle and where you excel in competitive situations, and which areas need the most attention. You may lose 100% of the deals against Competitor X, but you only come up against them once a year. But if you lose 15% of the deals against Competitor Y, who comes up in almost every competitive deal, that could be a key area to address to impact your overall competitive success. To create such a matrix, plot each competitor’s win / loss rate versus the number of opportunities that involve that competitor.
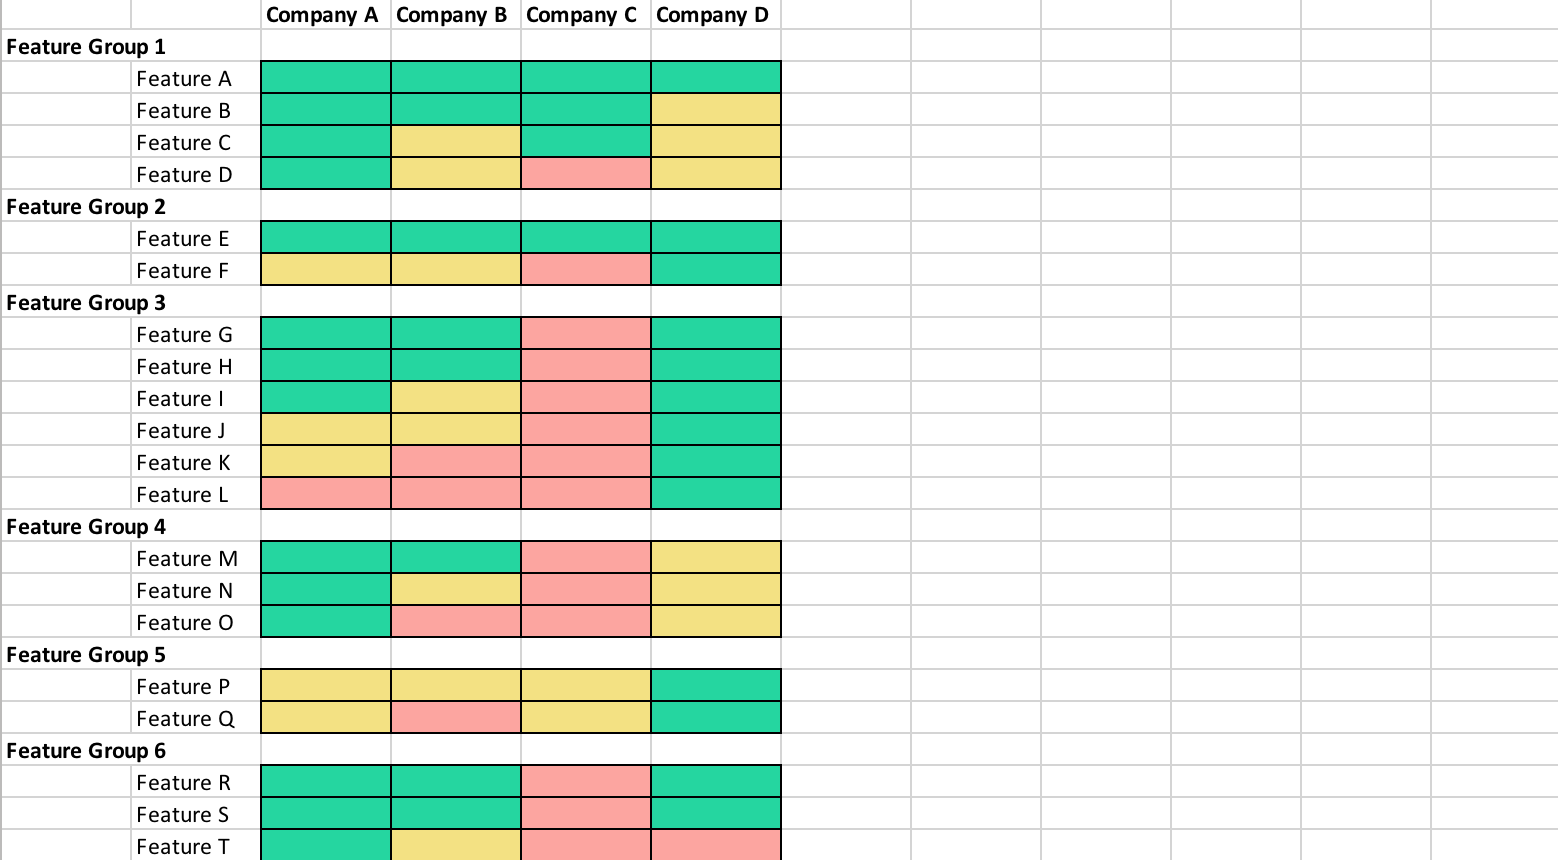
Feature Comparison Matrix
Sometimes getting into the weeds of a competing product’s functionality can help you uncover areas of differentiation and key areas of weakness. A no-frills feature comparison matrix is a helpful tool for comparing each competing product’s capabilities. Grouping features and using simple symbols or colors for evaluation markers can help you spot trends in a long list of features.
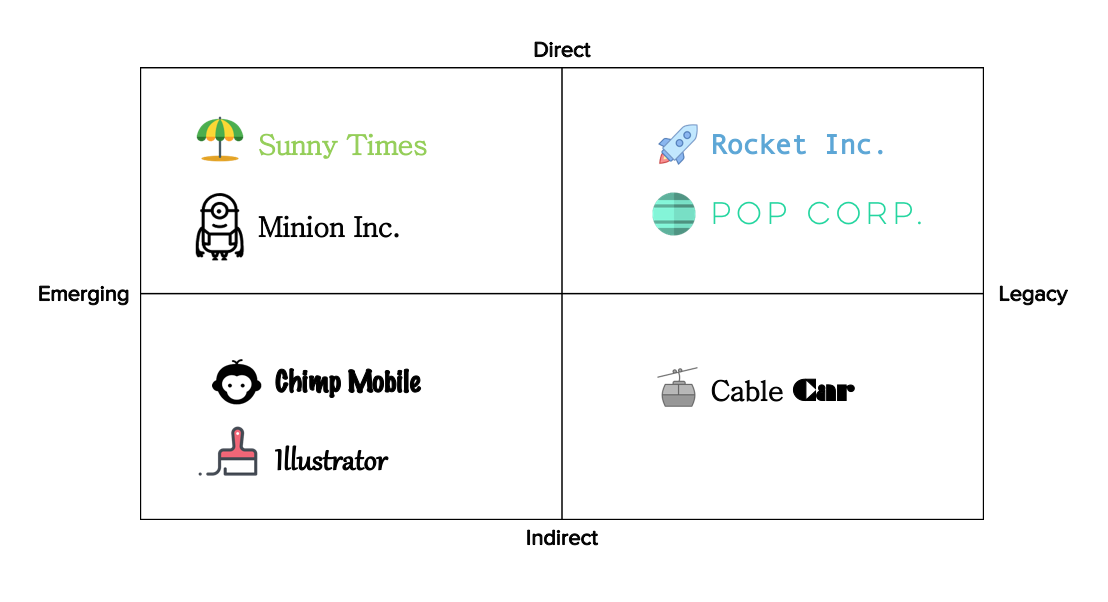
Competitive Landscape Overview Matrix
On the flip side, a simple custom competitive overview matrix can provide a great high level view of the competitive landscape, especially for new employees getting a handle on a crowded market. Feel free to use your own definitions of competitive groups – legacy vs. emerging competitors, software vs. hardware competitors, direct vs. indirect competitors, or any other custom groupings. Try different ways of displaying this overview to be most functional for your use case – need a quick visual for a new employee training? A four-quadrant graph may be the right approach. Need a filter to find examples of competitors along different dimensions? An interactive database may be the right approach.
Tip: Combine Competitor Matrix Examples for Further Analysis
It can be helpful to combine dimensions from multiple approaches mentioned above to surface additional trends. For example, the Win / Loss Matrix can be color-coded based on Competitor Groups. This can help you spot that all of your high volume / high win rate cases occur with “legacy competitors” but you struggle with low win rates among “emerging competitors” – a growing concern that needs attention even if each emerging competitor individually does not come up often. You could even go so far as to plot all “legacy competitors” and all “emerging competitors” on the Win / Loss Matrix to spot this trend even more clearly. Combining these different approaches can help you see the market from a new lens to identify threats and opportunities to drive strategic competitive initiatives.
Plotting your competitors – alongside your own company – can provide the perspective you need to benchmark your company’s strengths and weaknesses and establish the context for every other market movement. “Contender” hire a new VP Customer Success? Knowing customer success is one of their weakest points, you would rightly take notice to see how this changes their market status. “Visionary” get a new round of funding? Time to pay attention to how they scale up and bring their innovative solutions to more customers.